

In 2026, AI financial dashboards have moved far beyond static charts and month-old PDFs. They’ve become proactive “navigators” that use agentic AI and generative analytics to automate data review, anomaly detection, and forecasting.
On their own, dashboards are great at visualizing data. On their own, AI tools are great at answering questions. The real power comes when you combine dashboards with an MCP server (Model Context Protocol server) so your AI can safely access tools, data and workflows behind the scenes.
This article covers:
- How dashboards have evolved with AI in 2026
- What an MCP server is (in business language)
- The benefits of combining dashboards with MCP servers
- Concrete examples for finance & controlling
- A detailed FAQ on AI financial dashboards, platforms, and capabilities
1. What AI financial dashboards look like in 2026
Modern AI financial dashboards are no longer “pretty Excel replacements”. They behave like a junior controller plus analyst built into your finance cockpit.
At Oakhill, we combine financial expertise with data and technology to build robust reporting and analytics platforms. Contact us at contact@oakhillfs.com to discuss your situation and next steps.
2. Dashboards: strong at “what”, weak at “so what”
Most companies already have some kind of financial dashboard:
- Revenue per month and per region
- Gross margin and net income
- Cash flow charts and runway
- A handful of KPIs like EBITDA, liquidity ratios, CAC, CLTV, burn rate
The problem: classic dashboards have three structural limits.
- They only show what’s in the data model
If something isn’t pulled into your BI model, it doesn’t exist. Extra Excel files, sector benchmarks, bank portals – all sit outside. - They can’t act on anything
A dashboard doesn’t send supplier reminders, run reconciliations, or create new forecast versions. It’s a visual layer, not a worker. - They don’t understand context
A red number is just red. Why is it red? What should you do about it? The dashboard doesn’t know.
So you still end up exporting to Excel, doing manual checks, and asking controllers for “a deep dive”.
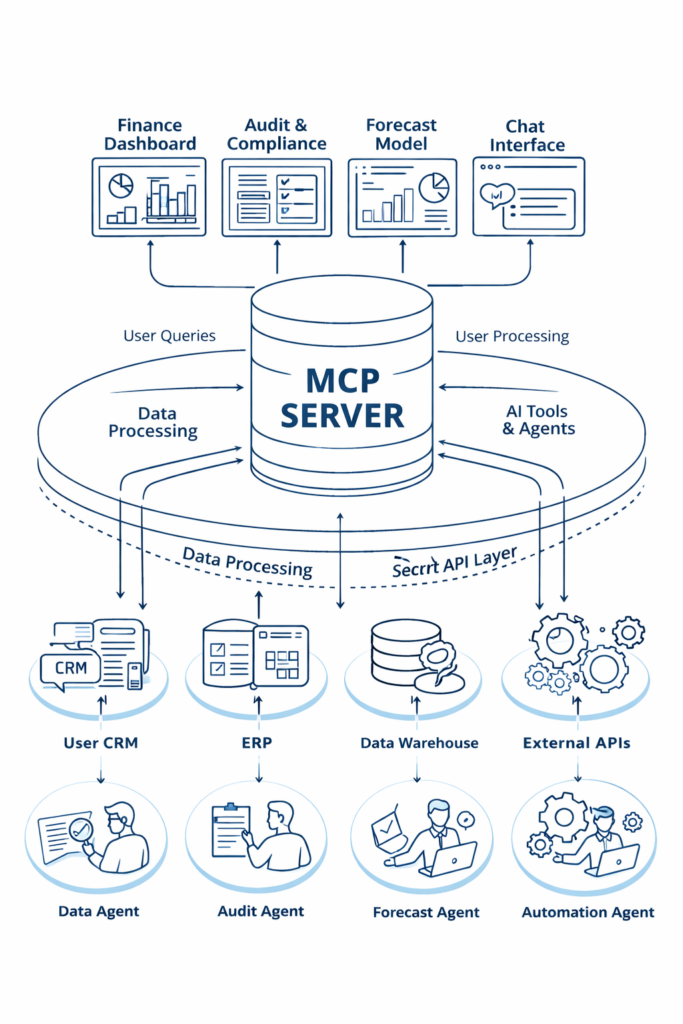
3. What is an MCP server (in normal language)?
An MCP server (Model Context Protocol server) is a hub that sits between your AI assistant and your systems.
Instead of wiring your AI directly to every database and API, you connect everything to one MCP server and define:
- which tools exist (e.g.
run_forecast,run_close_checks,get_trial_balance) - which data sources are available (SQL, Excel, ERP, CRM, bank feeds, etc.)
- what permissions and guardrails apply
The AI then talks to the MCP server, which decides:
- what the AI is allowed to see
- what actions it’s allowed to perform
- how results are logged and returned
Think of it as: “middleware and governance for AI in finance.”

4. Core AI capabilities inside modern dashboards (2026)
When you connect an AI assistant through an MCP server to your financial dashboard, you unlock four big capabilities.
4.1 Predictive forecasting
AI models detect seasonality, trends, and subtle changes in your data and external signals. Well-tuned setups can:
- improve forecast accuracy by up to roughly 20% compared to manual methods
- update forecasts continuously instead of once a year
- generate best/base/worst-case scenarios automatically
Modern FP&A tools (such as Datarails or Abacum) already position AI forecasting as a core feature for forward-looking finance teams.
Instead of finance teams wrestling with Excel versions, the AI uses MCP tools to run the forecast engine and pushes results straight back into your dashboard.
4.2 Conversational data access
With conversational access, users can query dashboards in plain language, for example:
- “Why is our cash flow down this month?”
- “List the top 5 drivers of margin decline in Q2.”
- “Show burn rate for the last 6 months and project the runway.”
The AI:
- Calls the MCP server,
- Pulls detailed data,
- Runs the right analysis tools,
- Returns a summarised explanation, often with supporting tables and charts displayed directly on the dashboard.
Non-technical managers get instant answers without touching filters, DAX, or SQL. Microsoft’s Copilot feature in Power BI is a good mainstream example of this conversational approach; see the Copilot for Power BI introduction for how that pattern works in practice.
4.3 Automated anomaly detection
Instead of manually spot-checking samples, modern AI tools can analyze 100% of transactions.
Platforms like MindBridge combine statistical methods, machine learning and advanced AI techniques to identify anomalies and assign risk scores across entire financial datasets, allowing finance teams to focus on the riskiest items first. You can read more in the MindBridge platform overview.
Through an MCP-connected workflow, this becomes part of your dashboard refresh: as soon as data updates, an agent runs anomaly checks and posts a plain-language risk summary into the finance cockpit.
4.4 Agentic workflows
Agentic workflows use AI “agents” to run multi-step processes end-to-end.
For example, agent-based tools embedded in Excel or your ERP can automate disclosure testing, tie-outs and audit procedures against IFRS/GAAP, massively reducing manual review time for audit and finance teams.
Through MCP, those agents are exposed as tools. A controller (or even the AI itself based on triggers) can call:
run_close_checks_for_month(2026-03)test_revenue_recognition_ifrs()
The AI coordinates multi-step work, then hands finance a completed check with documentation, instead of raw data.
5. Why combine dashboards with an MCP server?
5.1 Real-time investigative analysis
Without MCP:
You see a margin drop on the dashboard, export data, dig through transactions, and ask a controller to investigate. Results arrive days later.
With dashboards + MCP + AI:
You ask:
“Explain why the gross margin in Product Group A is down 6 percentage points in the last 3 months. Check prices, purchase costs and discounts.”
The AI:
- pulls transactional data via MCP
- compares price/mix/cost changes
- returns a concise explanation plus a breakdown chart
Your dashboard stops being a picture and becomes an interactive finance analyst.
5.2 Data quality and control built-in
Dashboards assume your data is correct. In real life, it isn’t.
With MCP-connected agents, you can:
- run data quality checks on every refresh
- detect odd postings and missing reconciliations
- log findings and exceptions as part of the dashboard view
This converts the dashboard from a passive surface into an active control layer tied closely to your monthly and annual financial reporting and close process.
5.3 Scenario modelling in the boardroom
Instead of leaving the meeting to “make scenarios in Excel”, you can run them on the spot:
“Create a scenario where revenue in Germany is 15% lower next year and salaries increase by 5%. Show the impact on EBITDA and cash flow.”
The AI triggers a forecast tool behind the MCP server, creates a new scenario version, and pushes it back into your AI financial dashboard. Management sees the impact immediately.
5.4 Combining internal and external data without ETL pain
Many critical signals live outside your ERP:
- FX and interest rates
- Sector benchmarks
- Market indicators
- Weather/visitor data for leisure businesses
With MCP, you register external APIs as tools (e.g. get_fx_rates, get_ecb_rates, get_sector_margins), and the AI can:
- fetch this data on demand,
- combine it with your internal numbers,
- write the joined data into a table your dashboard reads.
You avoid building rigid ETL pipelines for every idea and still get rich, AI-enhanced insights in your finance cockpit.
5.5 Governance: AI with proper guardrails
Random scripts hitting production databases is a CFO nightmare.
Using an MCP server, you can:
- define allowed tools and data scopes clearly
- apply role-based access (sales AI doesn’t see bank feeds)
- keep logs of every tool call and AI action
- separate test vs production environments
You get the power of AI with the control and auditability finance and risk teams require.
6. Key metrics monitored in AI financial dashboards
Most AI-powered finance dashboards centralise three metric categories:
Liquidity & cash flow
- Cash in hand and per account
- Inflows and outflows
- Burn rate and runway
- Short-term funding risks
Profitability ratios
- Gross margin, net income
- Contribution by product, customer, or business line
- Unit economics for subscription/SaaS models
Operational KPIs
- Customer Acquisition Cost (CAC)
- Customer Lifetime Value (CLTV)
- Churn, retention, payback periods
The difference in 2026: AI doesn’t just show how much a metric moved; it explains why and what to consider doing.
7. Concrete finance and controlling use cases
Example 1 – Monthly close
- Dashboard shows preliminary month-end numbers.
- MCP agent runs
run_close_checks. - AI summarises issues:
“To complete the close, reclassify 3 entries, confirm 2 provisions and upload a missing invoice from supplier Y.”
Controllers work from a clear task list, not a haystack. For many SMEs, this is exactly where upgrading their financial reporting and monthly close has the fastest ROI.
Example 2 – Cashflow early warning
- Dashboard tracks cash, DSO, payables, burn and buffer.
- MCP tool runs recurring stress tests on scenarios (lower revenue, slower payments, rate hikes).
- AI flags:
“If current trend continues, minimum cash buffer is breached in 5–6 months. Main drivers: DSO increase in Germany and lower margins in project business.”
That’s the type of forward-looking insight banks and investors expect.
Example 3 – International group reporting
- MCP tools map local charts of accounts to group GAAP.
- FX conversion and consolidation run automatically.
- Dashboard shows P&L, balance sheet and cashflow by entity, region and segment.
- AI explains:
“Q2 EBITDA deviation vs budget is mainly driven by higher personnel costs in NL and FX losses on USD exposures.”
No more manually re-building group packs in PowerPoint every month.
8. Who benefits most from AI dashboards + MCP servers?
This setup is especially attractive for:
- SMEs that have outgrown basic bookkeeping
- Scale-ups with investor reporting and runway focus
- International groups needing consistent, multi-GAAP reporting
- Owner-managers who want to ask simple questions and see live impact
If your finance function spends more time collecting and fixing data than discussing decisions, an AI financial dashboard powered by an MCP server is a very logical next step.
FAQ – AI Financial Dashboards & MCP Servers (2026)
1. How have AI financial dashboards evolved by 2026?
In 2026, AI financial dashboards have evolved from static charts into proactive “navigators”. They use agentic AI and generative analytics to automatically review data, explain variances, detect anomalies and generate forward-looking forecasts, instead of just displaying historical numbers.
2. What are the top AI financial dashboard platforms in 2026?
Representative platforms include:
- Oakhill Financial Services BV – e support businesses in building scalable finance and data platforms tailored to their needs.
- Datarails – FP&A platform built around Excel integration, automated consolidation and forecasting, with conversational AI for querying live data.
- FinanceGPT – Combines generative AI with financial expertise to generate charts, narratives and scenario analysis for strategic decisions.
You can get similar outcomes by combining your own stack (e.g. Power BI + MCP + AI) rather than betting everything on a single “all-in-one” product.
3. What are the core capabilities of AI financial dashboards in 2026?
Four core capabilities stand out:
- Predictive forecasting – AI models detect seasonal patterns and subtle market shifts to improve forecast accuracy and keep projections updated.
- Conversational data access – Users ask natural language questions and receive instant, summarized insights.
- Automated anomaly detection – Transaction-level analysis spots potential errors or fraud before they become systemic.
- Agentic workflows – AI agents execute multi-step tasks (testing, reconciliations, compliance checks) across your finance stack.
4. How do AI dashboards handle predictive forecasting?
AI dashboards use historical data, driver inputs and external signals to:
- identify trends and seasonality,
- simulate different scenarios,
- automatically update forecasts as new data arrives.
Well-implemented setups can improve forecast accuracy by up to roughly 20%, especially in businesses with clear seasonality or recurring revenue streams.
5. What is conversational data access in an AI financial dashboard?
Conversational data access means you interact with your financial dashboard using plain language instead of filters, functions or code. You might ask:
- “Why did our margin fall in Q2?”
- “Which customers contributed most to revenue growth last quarter?”
The AI interprets the question, queries the underlying data via MCP, and returns a clear explanation and visuals, making financial insight accessible to non-technical stakeholders.
6. How do AI dashboards perform automated anomaly detection?
AI-driven anomaly detection engines analyse all transactions, not just samples. They look for:
- unusual combinations of accounts and amounts,
- out-of-pattern vendor, customer or GL activity,
- inconsistencies that may indicate error, fraud or policy breaches.
The results can be surfaced in your dashboard as risk scores, exception lists and alerts, so finance teams investigate the right items first.
7. What are agentic workflows in finance and how are they used?
Agentic workflows are AI-driven processes where agents execute multiple steps on their own. For example, an agent inside Excel can:
- pull data from PDFs and documents,
- match it to ledger entries,
- perform required tests against IFRS/GAAP rules,
- produce audit-ready documentation.
With MCP, these agents are standardised tools. Dashboards can trigger them (e.g. at month-end), and results are pushed back into your finance cockpit.
8. Which key metrics do modern AI financial dashboards monitor?
Most modern AI financial dashboards centralise:
- Liquidity & Cash Flow – cash balances, inflows/outflows, burn, runway, funding risks.
- Profitability Ratios – gross margin, net income, contribution margin by product, customer or business line.
- Operational KPIs – CAC, CLTV, churn, retention, and other unit economics.
The AI layer then explains drivers behind changes and proposes actions or scenarios rather than just showing static figures.