The monthly financial report – expert insights, clear action
Alongside your real-time dashboard, you’ll receive a structured monthly report with expert CFO analysis. Our reports are designed for business owners, not accountants—delivering clarity, strategy, and next steps.
Financial Overview
Your revenue, profits, and margins in a clear format.
Cash Flow Summary
Know where your money is going and how to optimize it.
KPI Analysis & Benchmarks
Custom metrics tailored to your business.
Risk & Opportunity Insights
Identify potential challenges before they arise.
Actionable CFO Recommendations
Strategic advice to drive better decisions.
Plan een gratis strategie gesprek
Why choose Oakhill insights?
We combine cutting-edge technology with expert financial guidance to deliver actionable insights that drive your business forward.
One source of truth
Expert guidance included
Plug & play setup
Scalable for every business
Frequently ask questions
What is a Power BI dashboard?
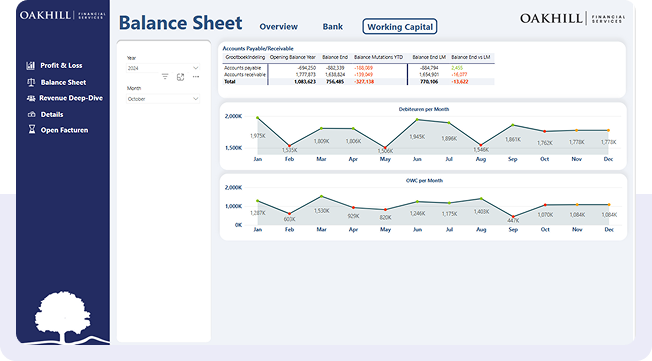
A Power BI dashboard is a visual, interactive report that combines your financial data into one clear overview. It helps you monitor key metrics—like revenue, profit margins, cash flow, and customer trends—in real time. At Oakhill, we use Power BI to transform your raw bookkeeping data into actionable insights, so you can steer your business with confidence.
Is Power BI dashboard free?
Power BI has a free version that works for basic dashboards. However, to share dashboards across your team or access advanced features like automated updates and integrations, you’ll need a Power BI Pro license. Oakhill clients don’t need to worry about licensing—we take care of setup, hosting, and maintenance in our fixed monthly fee.
What is the difference between Power BI reports and dashboards?
A Power BI report is a multi-page document with detailed charts and tables that let you explore your data in depth. A dashboard is a one-page summary that shows only the most important metrics at a glance. At Oakhill, we combine both: you get monthly Power BI reports for in-depth analysis, and dashboards for quick decision-making.
Is Power BI better than Tableau?
Both tools are powerful, but Power BI is generally:
More cost-effective, especially for SMEs
Easier to integrate with tools like Excel and your accounting software
Designed with Microsoft users in mind While Tableau is popular in data science and enterprise environments, Power BI is the ideal choice for business finance reporting—which is why we’ve standardized on it at Oakhill.
What insights will I get from the Power BI financial dashboard?
With our Power BI dashboard, you get real-time insights into the financial health of your business. Key metrics include:
Revenue and cost trends (month-over-month, year-to-date)
Profit & Loss breakdowns
Cash flow forecasts and liquidity status
Customer and product profitability
Budget vs. actual performance These insights help you make faster, data-driven decisions—without waiting for your accountant to send a spreadsheet.
How is Oakhill’s dashboard different from other financial reporting tools?
Most dashboards just show the numbers—we go a step further. Oakhill’s dashboards are:
Fully customized to your business and sector
Linked directly to your bookkeeping software (Exact, AFAS, etc.)
Delivered with monthly expert interpretation and clear recommendations It’s not just a dashboard—it’s a plug-and-play finance control system designed to grow with your company.
Ready to gain financial clarity?
Get started with Oakhill Insights today and take control of your business’s financial future.